


A review of data from the past 200 years indicates not only a huge increase in the world's population, but an even more significant increase in real incomes. This is illustrated using the data series developed by the late Angus Maddison of the Organization for Economic Cooperation and Development that included historic estimates of economic performance by geographical area (nations and other reported geographies) from 1500 to 2000. The Maddison data is expressed in international dollars adjusted for purchasing power, so that the impact of inflation and differing prices is factored out, to the extent feasible. Caution is required, however, because there are difficulties with longer term purchasing power and inflation time-series, not least because technological advances make it nearly impossible to accurately account for the changed standard of living. For example, there were no telephones of any sort in 1820, yet today, low-income Nigeria has 143 million mobile phones, nearly 90 for every 100 persons.
I extended the Maddison data for another 10 years, to 2010, using the database of the International Monetary Fund (IMF) and converted all data to 2010 inflation adjusted international dollars.
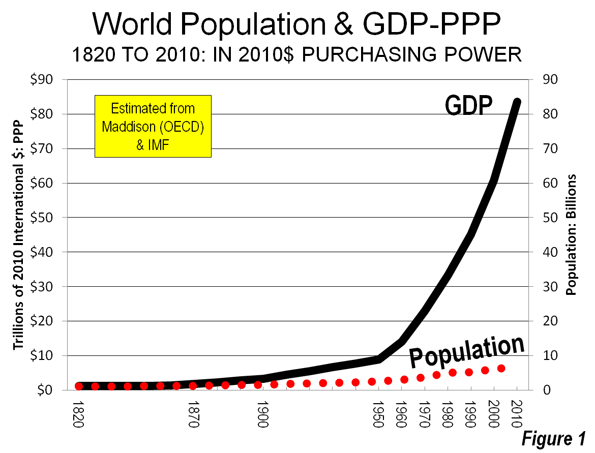
Fast Population Growth and Faster Economic Growth
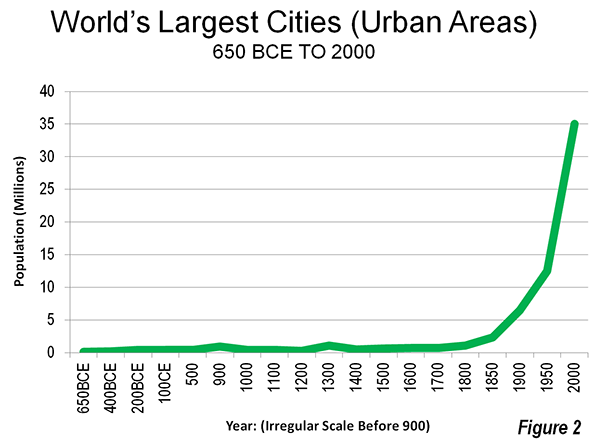
Between 1820 and 2010, the world population grew from 1.0 billion to 6.8 billion as indicated in the databases. This 550% increase, however, pales by comparison to the increase in the world real gross domestic product (GDP), which grew nearly 13 times as fast as the population (Figure 1). The relationship between rising urbanization and increasing wealth is evident in comparing Figure 1 to Figure 2 from the recent feature What is A Half-Urban World. Between 1820 and 1900, the real economic growth rate was 1.5 times of that of population growth. This improved to 2.2 times between 1900 and 1950. In each of these succeeding decades, the economic growth rate relative to population growth was even greater, except in the decade of the 1980s when economic growth was 1.9 times population growth. Despite the economic difficulties, particularly in Japan and the West, 2000 to 2010 showed the largest rate of economic growth compared to population growth, at 3.0.
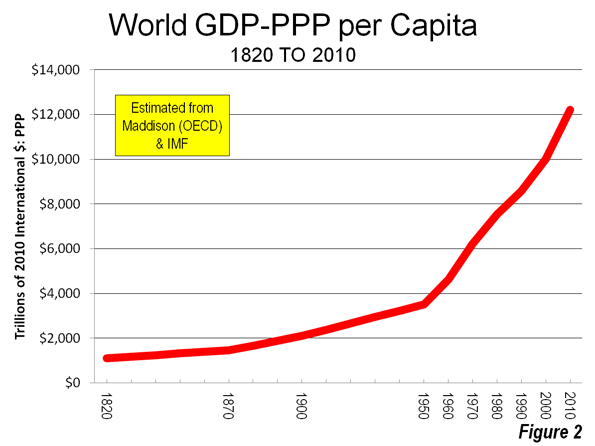
GDP Per Capita (Purchasing Power)
The real GDP per capita data strongly indicates the expanding economic pie. In 1820, the world GDP per capita was approximately $1100, expressed in 2010$, adjusted for purchasing power. By 1900, this had nearly doubled to $2100. The largest gains came after 1950 when the GDP per capita reached $3500. Since that time the GDP per capita has risen to $12,200 (Figure 2).
A History of Poverty
Even so, the history of economics is a history of poverty. University of Rochester (NY) Economist stated the case this way:
Modern humans first emerged about 100,000 years ago. For the next 99,800 years or so, nothing happened. Well, not quite nothing. There were wars, political intrigue, the invention of agriculture – but none of that stuff had much effect on the quality of people’s lives. Almost everyone lived on the modern equivalent of $400 to $600 a year, just above the subsistence level.
The $1100 GDP per capita from 1820 would rank among the poorest areas in the world today. The world's richest area at that time was the Netherlands, which had a GDP per capita of $3100. This is more than Nigeria today, with its 143 million mobile phones and nearly as high as the GDP per capita of India.
Distribution of Income
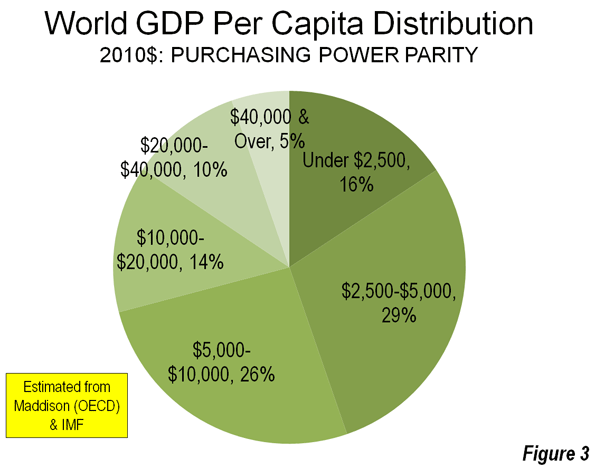
Today, the large majority of the world's population lives in lower income areas.
- 16% of the population lives in areas with a GDP per capita of less than $2500. The largest of these are Bangladesh and Tanzania.
- 29% of the world's population is in areas with a GDP per capita of $2500 to $5000. The largest are India, Indonesia, Pakistan, Bangladesh, Nigeria and the Philippines.
- 26% live in low middle income areas with a GDP per capita of between $5000 and $10,000, such as China and Ukraine.
- 14% live higher middle income areas (a per capita GDP of $10,000 to $20,000). The largest such areas are Brazil, Mexico and Russia.
- 10% of the population lives in relatively well off areas (a GDP per capita of $20,000 to $40,000) including France, the United Kingdom, Korea and Japan.
- Only 5% of the world's population enjoys a GDP per capita exceeding $40,000, the largest of which are the United States, Germany, Canada and Australia. (Figure 3).
The Richest Areas
The very richest countries in the world on a per capita basis are generally small. Oil rich Qatar has the highest GDP per capita at nearly $100,000 annually. Europe's Luxemburg is the second most affluent, followed by the city-state of Singapore. Resource rich Brunei-Darassalam is the world's fifth richest area. The United States ranks sixth and is by far the largest of the richest areas. More than 55% of the world's population in areas with more than $40,000 GDP per capita lives in the United States. The balance of the richest 10 is completed by the United Arab Emirates, another oil rich Gulf state, the world's other large city-state, Hong Kong, as well as the Netherlands and Switzerland in Europe (Figure 4).

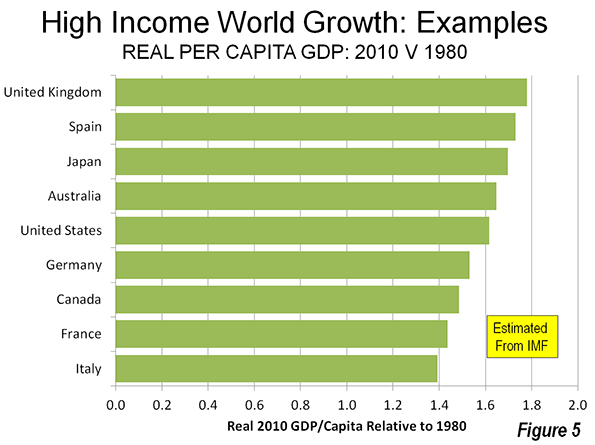
Generally, IMF data indicates that the largest high-income world economies have experienced real GDP per capita growth of from 40% to 80% since 1980. The UK has grown the most among the examples, while Italy has grown the least (Figure 5). Germany's lower growth rate is, at least in part, due to the complexity of combining virtually bankrupt East Germany with far healthier West Germany in the early 1990s. The US has been hobbled by its housing bubble-induced economic bust, which hurt other economies as well. Canada's recent stronger growth could presage an improved ranking in the years to come. Other areas, such Italy, Spain, Japan and France could experience slower growth in the future, due to the seemingly intractable fiscal difficulties and, in some cases, demographic stagnation or even decline.
Who’s Growing Rich Fastest?
A number of countries have experienced spectacular growth in their GDP per capita over the past three decades, according to the IMF data (Figure 6). Oil rich Equatorial Guinea experienced the greatest growth, reaching a GDP per capita more than 16 times the 1980s figure. Equatorial Guinea is small, with a population of only 700,000 people (similar to the size of metropolitan areas such as Colorado Springs, Colorado, Hamilton, Ontario or Florence, Italy).
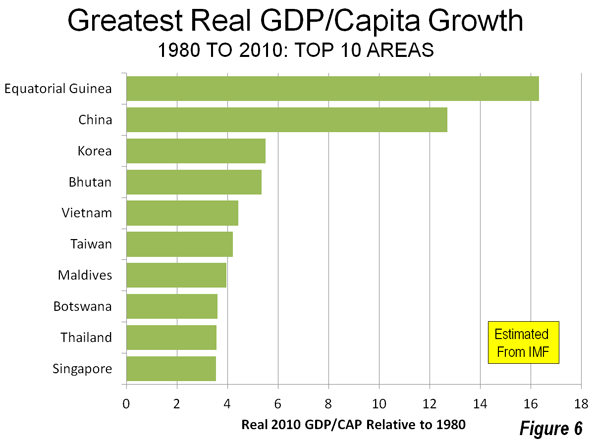
The broadest and most significant progress has been made by China. According to the IMF data, in 1980 China had the second lowest GDP per capita of any reporting area, ranking above only Mozambique. This was approximately the same time that the economic reforms began, under the leadership of Deng Xiaoping. By 2010, China's GDP per capita had reached more than 12 times the 1980 figure. China's gross GDP-PPP grew more than that of any other area. Once on the low end of the poverty league table China now has entered the middle rank in terms of wealth.
Other areas have also done well, especially in Asia. The largest of these include Korea, Vietnam, Taiwan, Thailand and Singapore. One African area is included among the fastest growing per capita economies, Botswana (Figure 6). Each of these areas grew from four to five times in GDP per capita from 1980.
The Poorest Areas
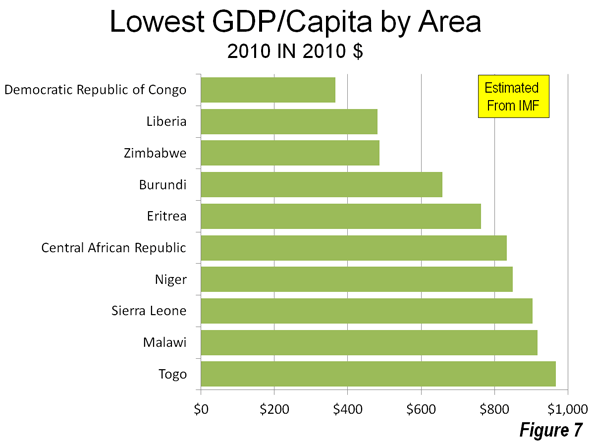
All 10 of the world's poorest areas are located in Africa. The poorest is the Democratic Republic of the Congo, with a GDP per capita of less than $400. Torn by civil war its GDP per capita would rank it among the poorest areas even in the 1820 listing. The four next poorest areas have also faced severe domestic disruptions, Liberia, Zimbabwe, Burundi and Eritrea (Figure 7).
Some Areas Getting Poorer
The severity of the world's poverty is indicated by the fact that 26 of the 138 areas for which there is data experienced declines in their GDPs per capita from 1980. The population of these declining areas was about 300 million, or approximately four percent of the world’s total. The Democratic Republic of the Congo, the world's poorest area, experienced a 60% decline in real GDP per capita, which was the largest decline.
Conclusion
While the economic pie has expanded much faster than its population, there is still plenty of poverty in the world. It is no surprise that the developing world focused the attention of the recent 2012 Rio +20 conference on poverty, with a declaration that eradicating poverty is the greatest global challenge facing the world today.
Photo: Ojota, Lagos, Nigeria (by Seun Oyeniran)
Reposted with permission. Originally posted on http://www.newgeography.com by Wendell Cox 11/29/2012
Wendell Cox is a Visiting Professor, Conservatoire National des Arts et Metiers, Paris and the author of “War on the Dream: How Anti-Sprawl Policy Threatens the Quality of Life.”
Wendell Cox is a Visiting Professor, Conservatoire National des Arts et Metiers, Paris and the author of “War on the Dream: How Anti-Sprawl Policy Threatens the Quality of Life.”